
GEMS: The "Safest" Portfolio
The “Safest” Portfolio
Often clients will come to us and ask us about investing in the “safest” portfolio. While it’s important to note that no investment can guarantee safety or eliminate risk entirely, this may seem like a straightforward question with an easy answer, but it isn’t. Everyone views risk differently, and their perspective on what is “safe” will naturally vary. In this GEMS, we discuss what “safety” could mean and then look at historical evidence to help guide how the answer would vary depending on what definition of “safety” is used by each client.
There are many ways to think about the “safety” of a portfolio. The most common way people think of “safety” is how likely or how often they will lose money. People view bank accounts as “safe” because they slowly accrue interest (and the balance doesn’t go down) and defaults of banks are rare. If you keep less than the FDIC insurance limit ($250,000 per depositor) in an account, then this can represent a very safe nominal alternative. We say a safe alternative because although bank accounts will protect the nominal value of your dollars, they won’t necessarily protect the purchasing power of those dollars. Another dimension outside of frequency of loss is the magnitude of loss. If there was an investment that made money every day for 10 years but then lost 100% of its value permanently once every 10 years, that would not be considered “safe” by most. In fact, we have seen that many would prefer investments that regularly lose 10-20% temporarily if they feel confident the losses won’t exceed certain thresholds. This discussion leads us to the realization that we must consider both the frequency and size of losses in both nominal and real terms when considering the safety of various portfolios.
There are two remaining points: over what time period should we do this analysis and what investments should we consider? For most analysis, and this one, we feel having the longest possible set of data is important as it allows these numbers to stand in the face of the widest possible set of adversities: two world wars, gold standard, a great depression, and many large recessions. We are using data of annual loss levels and standard going back to 1872 from a combination of Robert Shiller’s dataset¹ and Bloomberg. We consider annual changes in the value of investments over that 150+ years of data on various assets including short term US treasuries (1 year), long-term US treasuries (10 year), US equities, and gold.
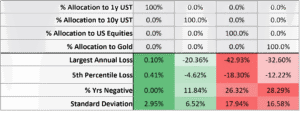
First let’s consider the nominal returns (before inflation) of each asset individually. Not surprisingly, 1 year US Treasuries we view the “safest” assets on every metric in the chart below – experiencing no less than a 0.1% gain in any one year. Based on the analysis, the 10-year US Treasuries are the next safest although over the 150+ years of returns they had negative returns in 11.8% of the years. They also had a maximum annual loss of 20.4% and the 5th percentile worst loss of 4.6%. Equities and gold had 26.3% and 28.3% of the years with negative returns and had maximum annual losses of 42.9% and 32.6% respectively.
Comparison of Losses with 100% Allocations to Various Assets

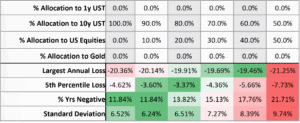
As a next step, let’s look at various combinations of 10y US Treasuries and US Equities to see if there are any correlation benefits from holding both assets. The portfolio based on the chart below that minimizes the largest annual loss is 60% bonds and 40% equities but the portfolio that minimizes the 5th percentile loss is 80% bonds and 20% equities. Further, the 80%/20% portfolio only losses money in 13.8% of years whereas the 60%/40% portfolio losses money in 17.7% of the years. From this we can infer that an 80% bond / 20% equity portfolio is “safer” than a 100% bond portfolio on every metric except the frequency of loss which is counterintuitive to most investors.
Losses on Portfolios of 10y US Treasuries and US Equities

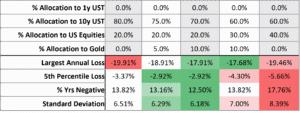
The environment in which both stocks and bonds do poorly is one of high inflation such as during the 1970s and 2022. In that environment, having an allocation to gold would help increase the “safety” of the portfolio. Moving from 80% bonds / 20% equities to 70% bonds / 20% equities / 10% gold would reduce the largest annual loss from 19.9% to 17.9%, reduce the 5th percentile worst loss from 3.4% to 2.9% and reduce the % of years with negative returns from 13.8% to 12.5%.
Losses on Portfolios of 10y US Treasuries, US Equities, and Gold

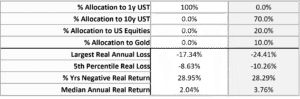
Finally, let’s compare our “safe” portfolio of 70% bonds, 20% equities and 10% gold to 1 year US Treasuries by looking at real returns (nominal returns minus inflation) by year. As you can see, once you switch from nominal to real, the 1-year US Treasury looks a lot “riskier.” Although the largest real annual loss is still less 17.3% vs 24.4%, the 5th Percentile real losses and % of years with negative real returns are surprisingly similar. Plus, the median annual real return for the 70/20/10 portfolio is 3.76% compared to just 2.04% for the 1-year US Treasury.
100% 1y US Treasuries vs. The “Safe” Portfolio

“Safety” and risk are in the eye of the beholder. While short-term US Treasuries provide the “safest” portfolio in nominal terms, a portfolio that holds long-term US Treasuries, US equities, and an inflation hedge like gold looks comparably “safe” in real terms and has the potential to produce a higher long-term return.
Important Disclosures:
¹ http://www.econ.yale.edu/~shiller/data.htm
This material is distributed for informational purposes only and should not be taken as a recommendation to purchase any individual security. The opinions expressed herein are those of GenTrust’s Investment Team as of January 2024 and any statements made regarding future events constitute only subjective views or beliefs, are not guarantees or projections of performance, should not be relied on, are subject to change due to a variety of factors, including fluctuating market conditions, and involve inherent risks and uncertainties, both general and specific, many of which cannot be predicted or quantified and are beyond our control. Future results could differ materially and no assurance is given that these statements are now or will prove to be accurate or complete in any way. Target exposures included in this material may differ between clients based upon their investment objectives, financial situations and risk tolerances. Any securities referenced herein do not represent all of the securities purchased, sold, or recommended to clients. A complete description of GenTrust’s performance calculation methodology is available upon request. Past performance is not a guarantee of future results. Certain information contained in this material is based on third-party sources and, although believed to be reliable, has not been independently verified and its accuracy or completeness cannot be guaranteed. No part of this material may be reproduced in any form, or referred to in any publication, without the express written permission of GenTrust.
Investors should not assume that investments in any security, asset class, sector, market, or strategy discussed in this communication will be profitable and no representations are made that clients will be able to achieve a certain level of performance, or avoid loss. Diversification does not protect against loss. Asset Allocation may be used in an effort to manage risk and enhance returns. It does not, however, guarantee a profit or protect against loss. This communication does not purport to contain all the relevant information that investors may wish to consider in making investment decisions and is not intended to be a substitute for exercising independent judgment. We recommend that investors independently evaluate the appropriateness of a particular investment or strategy. Investment results will fluctuate and may be highly volatile, particularly over the short term. A complete description of GenTrust’s performance calculation methodology is available upon request. Past performance is not a guarantee of future results.
The S&P 500 is an unmanaged weighted index of common stocks. An investment cannot be made directly in an index.
Treasury securities are backed by the full faith and credit of the U.S. government as to the timely payment of principal and interest only. The principal value will fluctuate with changes in market conditions. If they are not held to maturity, they may be worth more or less than their original value. The 10-year Treasury Note represents debt owed by the United States Treasury to the public. Since the U.S. Government is seen as a risk-free borrower, investors use the 10-year Treasury Note as a benchmark for the long-term bond market.
Gold represents the afternoon gold price as reported by the London Bullion Market Association (LBMA). The gold price is set twice daily by the London Gold Fixing Company at 10:30 and 15:00 and is expressed in U.S. dollars per fine troy ounce.
In applying the $250,000 insurance limit, the FDIC must add together all deposits owned by the same depositor in the same ownership capacity. In the case of deposits owned by a principal but held by an agent, custodian or nominee, the deposits are insured to the same extent as if deposited in the name of the principal.